Trading Pipelines — End-to-End Financial ML Framework
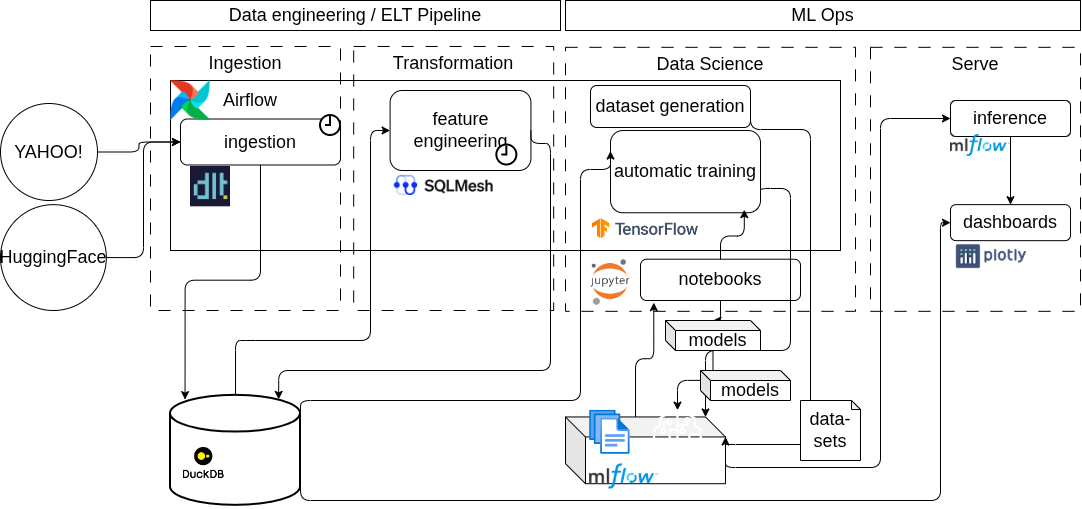
A proof-of-concept project that proposes an end-to-end architecture for a financial machine learning framework. It covers the full lifecycle — from raw market data ingestion and feature engineering to model training, hyperparameter optimization, model serving, and interactive visualization — all orchestrated as reproducible pipelines.
Architecture
The system is composed of five main layers:
Data Ingestion
Raw financial data is loaded into a local DuckDB database using dlt incremental pipelines, orchestrated by Apache Airflow:
- Yahoo Finance — daily, weekly, and monthly OHLCV prices, company metadata, and news for 50+ US equities via the
yfinanceAPI. - HuggingFace (FNSPID) — a large external dataset of historical stock news article titles.
Feature Engineering
SQLMesh transforms raw data into a rich feature store inside DuckDB:
- Technical indicators — returns, log returns, SMA/EMA, RSI, MACD, Bollinger Bands, ATR, stochastic oscillator, momentum, and more (~60+ features per row).
- Calendar features — hour, day of week, month, quarter, year with cyclical sin/cos encodings.
- LLM-powered embeddings — semantic descriptions and vector embeddings for each ticker generated via Ollama (Gemma 3), plus news article title embeddings.
Machine Learning Models
Three model families, all tracked in MLflow:
| Family | Purpose | Implementations |
|---|---|---|
| Forecast | Predict next-period stock returns | Dense NN, Conv1D+LSTM, Transformer encoder, XGBoost |
| Encoding | Compress ticker behavior into a latent space | PCA, KMeans, β-VAE (Conv1D+LSTM encoder/decoder) |
| Agents | RL-based portfolio allocation | Branching DQN, PPO (continuous), Threshold (rule-based baseline) |
Dataset generation creates lagged feature matrices with randomized lag intervals, logged as MLflow artifacts. Hyperparameter optimization is powered by Optuna with nested MLflow tracking. Forecast and encoding models feed into the trading agents — the agent observes predicted returns plus latent encodings and outputs portfolio weight allocations.
Model Serving
An orchestrator polls the MLflow model registry for models tagged with a "serve" alias, spawns inference instances, and routes traffic through an Nginx reverse proxy with automatic config reloading.
Dashboard
An interactive Plotly Dash application with three pages:
| Page | Description |
|---|---|
| Overview | Ticker embedding space visualization (PCA scatter), semantic descriptions, price charts, filterable data table |
| Forecast | Select a served model and visualize predicted vs. actual returns for any ticker and time range |
| Agents | Run full agent simulations with KPIs (Sharpe ratio, max drawdown, win rate), portfolio value over time, daily returns, and per-ticker trade logs |
Tech Stack
| Layer | Technologies |
|---|---|
| Orchestration | Apache Airflow 3, Docker Compose |
| Ingestion | dlt, yfinance, HuggingFace API |
| Storage | DuckDB |
| Feature Engineering | SQLMesh |
| ML / DL | TensorFlow/Keras, XGBoost, scikit-learn, JAX |
| Experiment Tracking | MLflow |
| Optimization | Optuna |
| Embeddings | Ollama (Gemma 3) |
| RL Environment | Custom Gym-style trading environment |
| Serving | MLflow Model Serving, Nginx |
| Visualization | Plotly Dash |
Running It
The entire stack runs via Docker Compose:
| |
Airflow DAGs are executed in sequence: data ingestion → feature engineering → dataset generation → (optional) hyperparameter optimization → model training. After training, assigning a "serve" alias to a model version in MLflow makes it available through the serving endpoint and the dashboard.
Code is available HERE